3.3.4. Process a line-pattern image
The following workflow shows how to use Discorpy to process a line-pattern image, collected at Beamline I13 Diamond Light Source.
Load the image, calculate the slopes of lines at the middle of the image and distances between. These values will be used by the grouping step.
import discorpy.losa.loadersaver as losa
import discorpy.prep.preprocessing as prep
import discorpy.prep.linepattern as lprep
import discorpy.proc.processing as proc
import discorpy.post.postprocessing as post


# Initial parameters
file_path = "../../data/line_pattern_01.jpg"
output_base = "E:/output_demo_04/"
num_coef = 5  # Number of polynomial coefficients

print("1-> Load image: {}".format(file_path))
mat0 = losa.load_image(file_path)
(height, width) = mat0.shape

print("2-> Calculate slope and distance between lines!!!")
slope_hor, dist_hor = lprep.calc_slope_distance_hor_lines(mat0)
slope_ver, dist_ver = lprep.calc_slope_distance_ver_lines(mat0)
print("    Horizontal slope: ", slope_hor, " Distance: ", dist_hor)
print("    Vertical slope: ", slope_ver, " Distance: ", dist_ver)
# Horizontal slope:  9.921048172113442e-16  Distance:  62.22050730757496
# Vertical slope:  1.5501637768927253e-17  Distance:  62.258521480417485

Fig. 3.3.4.1 Line-pattern image.
Points belong to lines are detected by locating local minimum points of intensity-profiles across the image. The number of intensity-profiles generated is controlled by the ratio parameter. The sensitive parameter controls the sensitivity of the detection method.
print("3-> Extract reference-points !!!!")
list_points_hor_lines = lprep.get_cross_points_hor_lines(mat0, slope_ver, dist_ver, ratio=0.5, sensitive=0.1)
list_points_ver_lines = lprep.get_cross_points_ver_lines(mat0, slope_hor, dist_hor, ratio=0.5, sensitive=0.1)
losa.save_plot_points(output_base + "/extracted_hor_points.png", list_points_hor_lines, height, width)
losa.save_plot_points(output_base + "/extracted_ver_points.png", list_points_ver_lines, height, width)
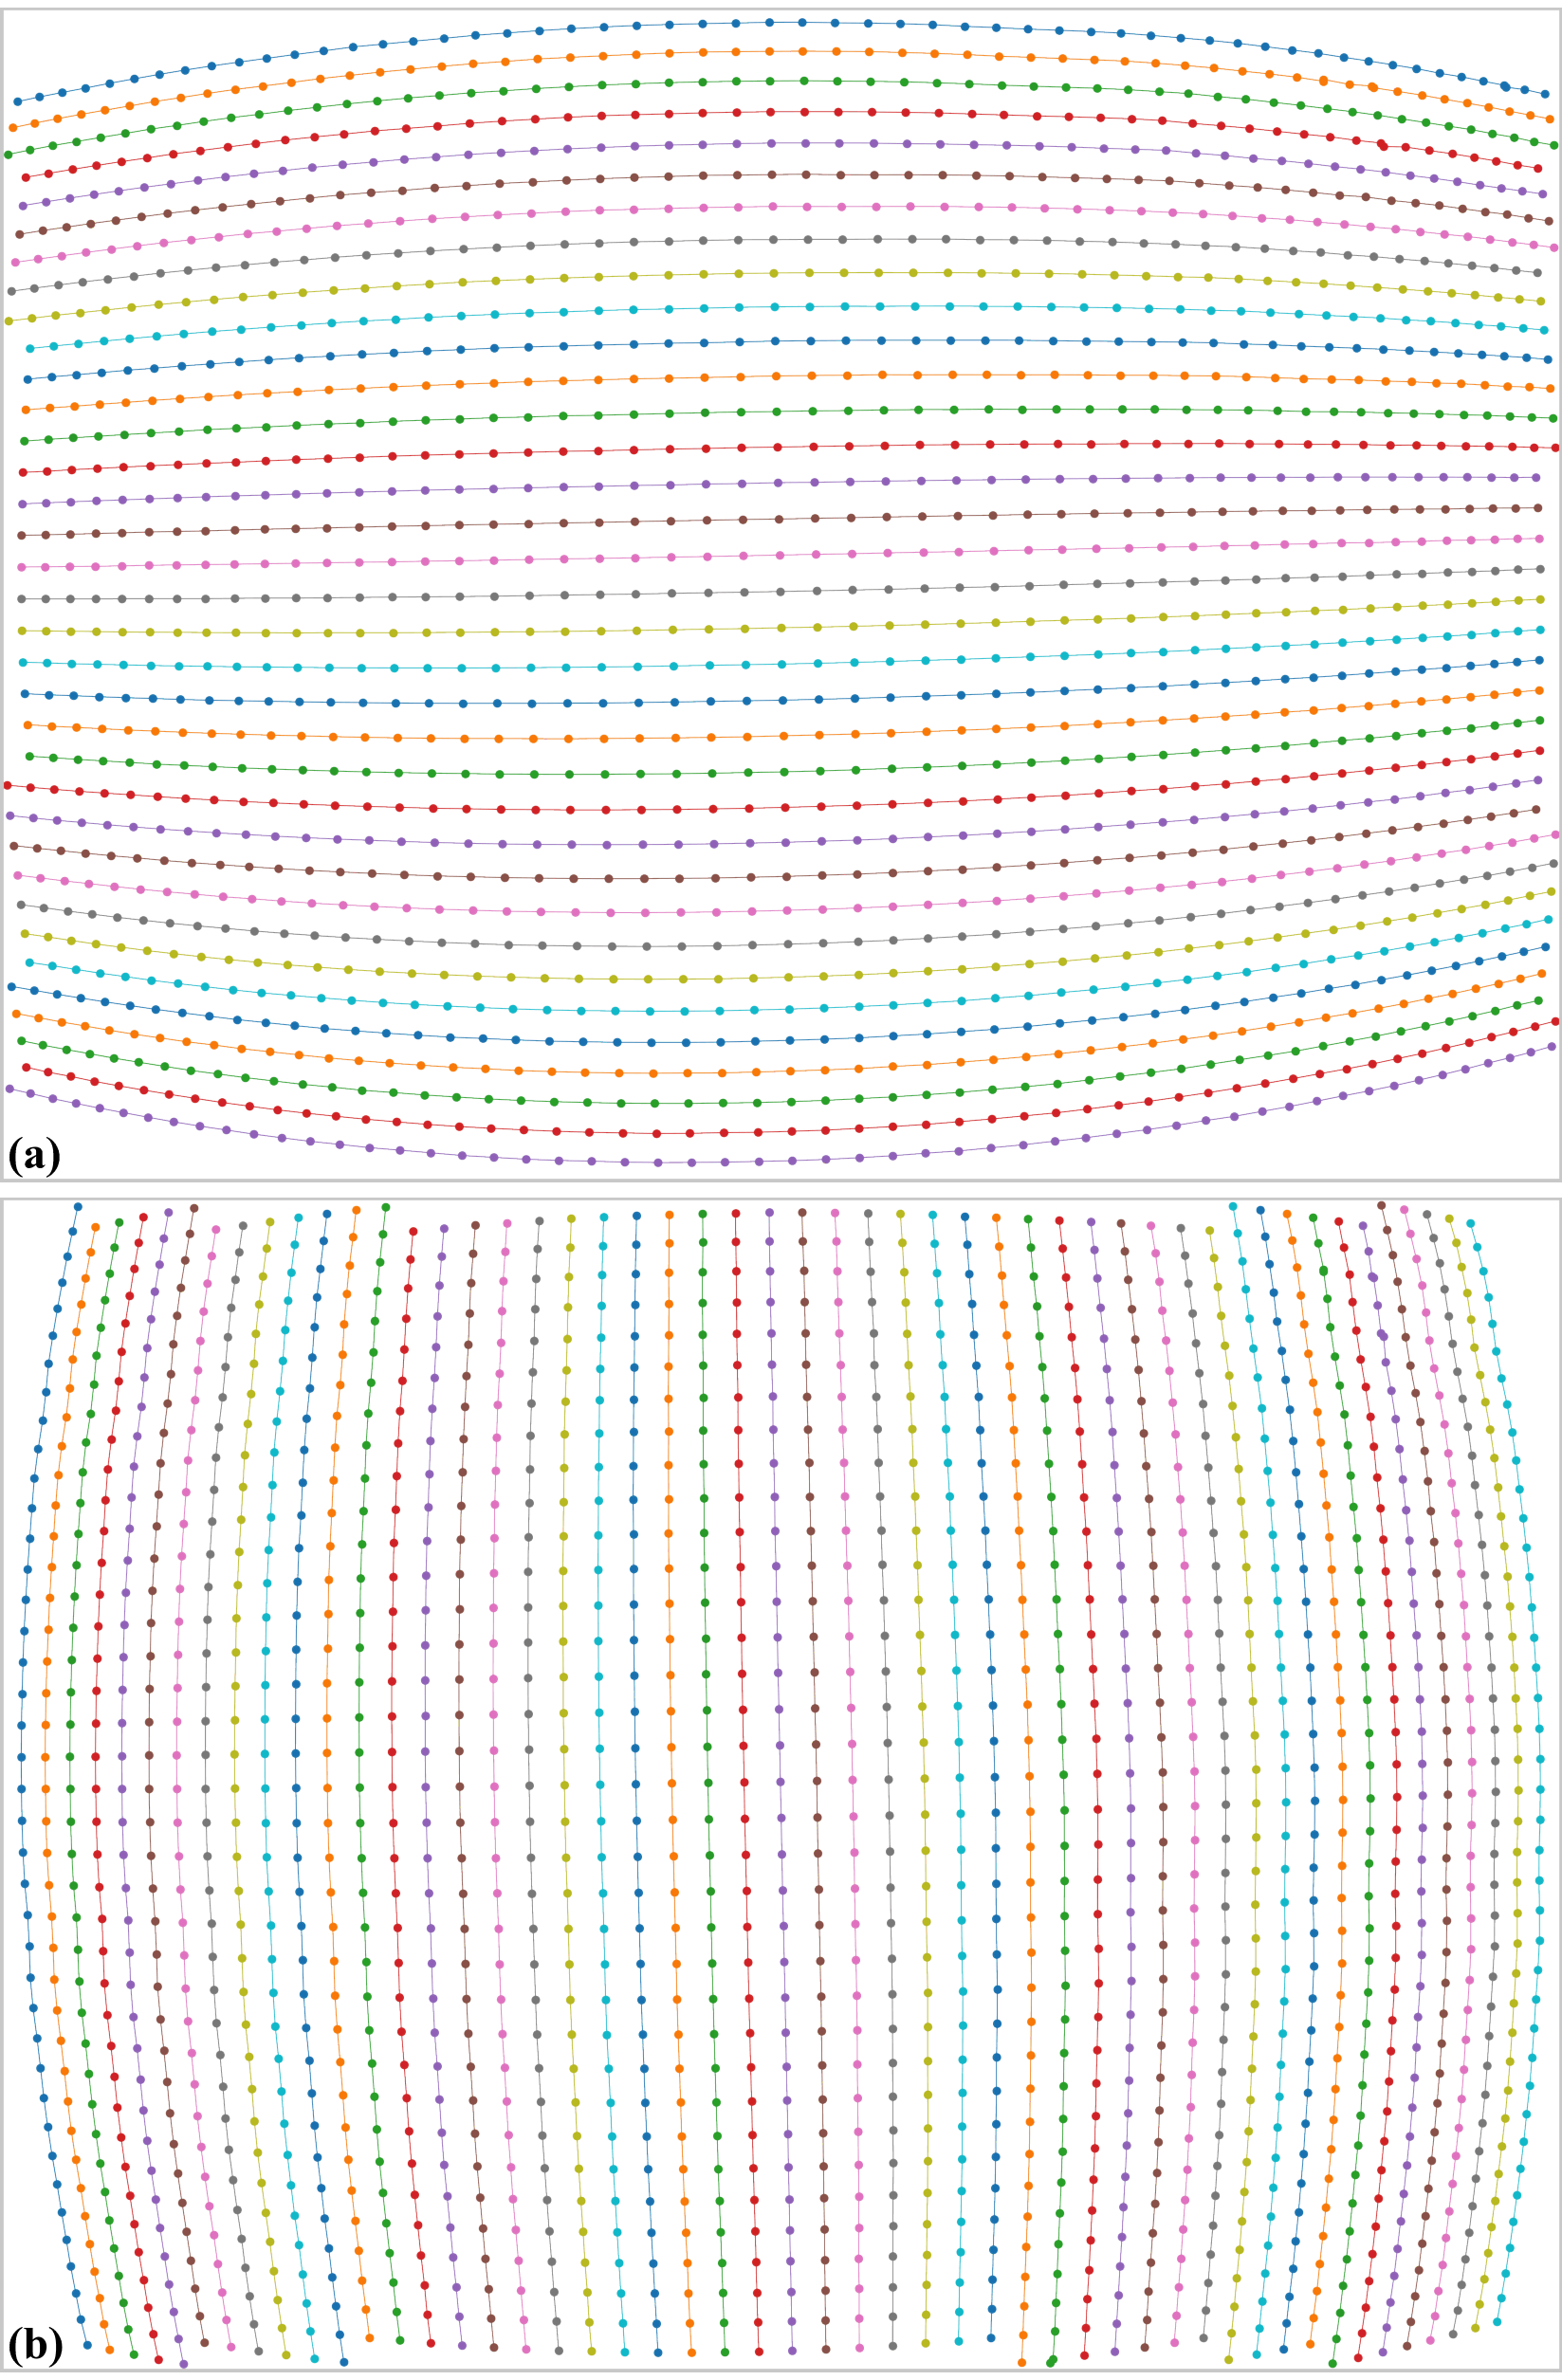
Fig. 3.3.4.2 Detected points. (a) Horizontal lines. (b) Vertical lines.
Group detected-points into lines (Fig. 3.3.4.3). This step can remove unwanted points.
print("4-> Group points into lines !!!!")
list_hor_lines = prep.group_dots_hor_lines(list_points_hor_lines, slope_hor, dist_hor)
list_ver_lines = prep.group_dots_ver_lines(list_points_ver_lines, slope_ver, dist_ver)
# Optional: remove residual dots
list_hor_lines = prep.remove_residual_dots_hor(list_hor_lines, slope_hor, 2.0)
list_ver_lines = prep.remove_residual_dots_ver(list_ver_lines, slope_ver, 2.0)
losa.save_plot_image(output_base + "/grouped_hor_lines.png", list_hor_lines, height, width)
losa.save_plot_image(output_base + "/grouped_ver_lines.png", list_ver_lines, height, width)
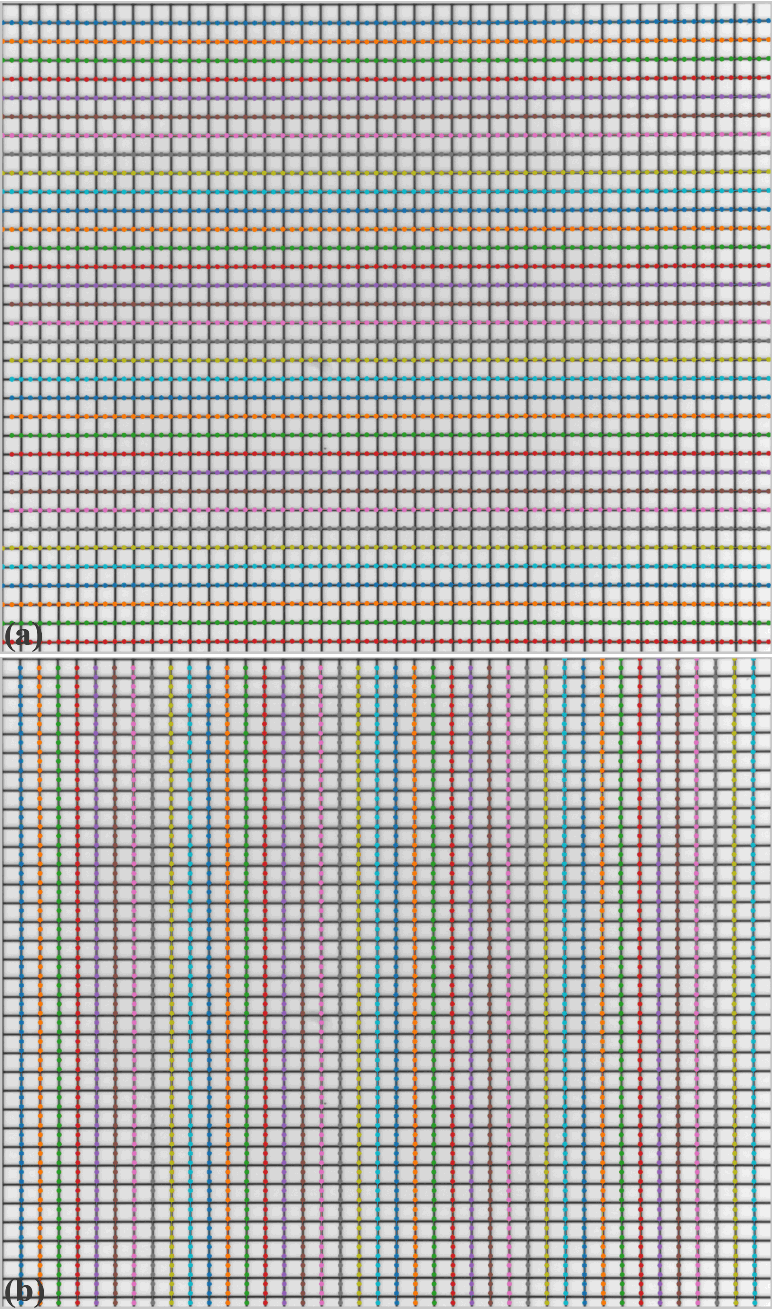
Fig. 3.3.4.3 Grouped points. (a) Horizontal lines. (b) Vertical lines.
The rest of the workflow is similar to other demos.
print("5-> Correct perspective effect !!!!")
# Optional: correct perspective effect.
list_hor_lines, list_ver_lines = proc.regenerate_grid_points_parabola(
    list_hor_lines, list_ver_lines, perspective=True)

# Check if the distortion is significant.
list_hor_data = post.calc_residual_hor(list_hor_lines, 0.0, 0.0)
losa.save_residual_plot(output_base + "/residual_horizontal_points_before.png",
                      list_hor_data, height, width)
list_ver_data = post.calc_residual_ver(list_ver_lines, 0.0, 0.0)
losa.save_residual_plot(output_base + "/residual_vertical_points_before.png",
                      list_ver_data, height, width)

print("6-> Calculate the centre of distortion !!!!")
(xcenter, ycenter) = proc.find_cod_coarse(list_hor_lines, list_ver_lines)
print("   X-center: {0}, Y-center: {1}".format(xcenter, ycenter))

print("7-> Calculate radial distortion coefficients !!!!")
list_fact = proc.calc_coef_backward(list_hor_lines, list_ver_lines, xcenter,
                                    ycenter, num_coef)

# Check the correction results
list_uhor_lines = post.unwarp_line_backward(list_hor_lines, xcenter, ycenter, list_fact)
list_uver_lines = post.unwarp_line_backward(list_ver_lines, xcenter, ycenter, list_fact)
list_hor_data = post.calc_residual_hor(list_uhor_lines, xcenter, ycenter)
list_ver_data = post.calc_residual_ver(list_uver_lines, xcenter, ycenter)
losa.save_residual_plot(output_base + "/residual_horizontal_points_after.png",
                      list_hor_data, height, width)
losa.save_residual_plot(output_base + "/residual_vertical_points_after.png",
                      list_ver_data, height, width)
# Output
print("8-> Apply correction to image !!!!")
corrected_mat = post.unwarp_image_backward(mat0, xcenter, ycenter, list_fact)
losa.save_image(output_base + "/corrected_image.tif", corrected_mat)
losa.save_metadata_txt(output_base + "/coefficients.txt", xcenter, ycenter, list_fact)
losa.save_image(output_base + "/difference.tif", mat0 - corrected_mat)
print("!!! Done !!!!")
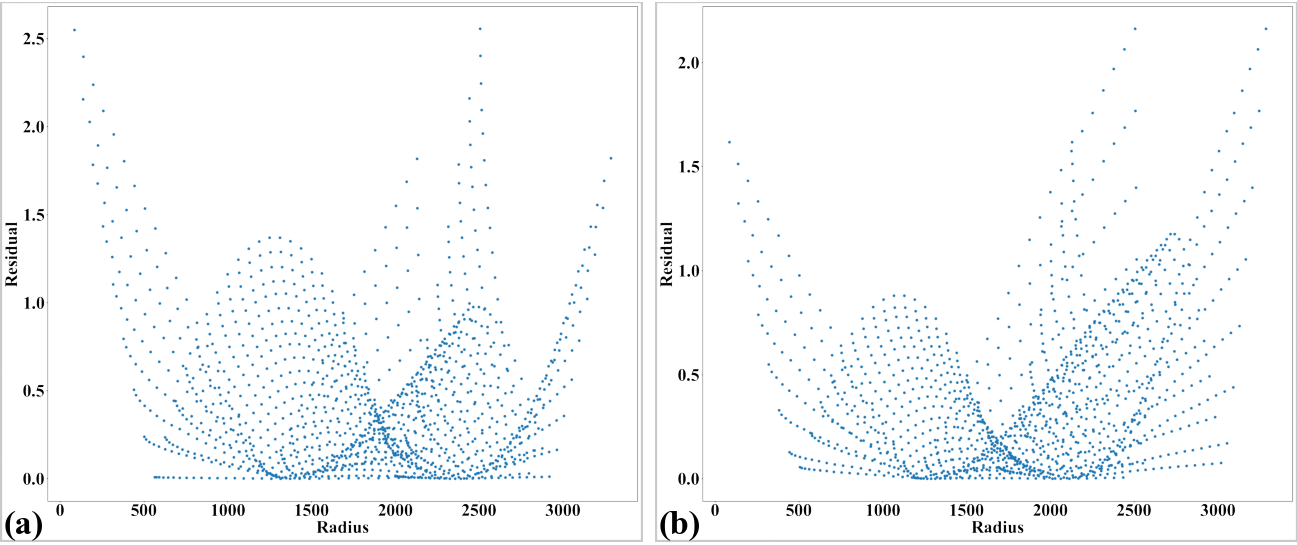
Fig. 3.3.4.4 Residual of distorted points. (a) Horizontal lines. (b) Vertical lines.
Fig. 3.3.4.5 Residual of unwarped points. (a) Horizontal lines. (b) Vertical lines.

Fig. 3.3.4.6 Unwarped image.
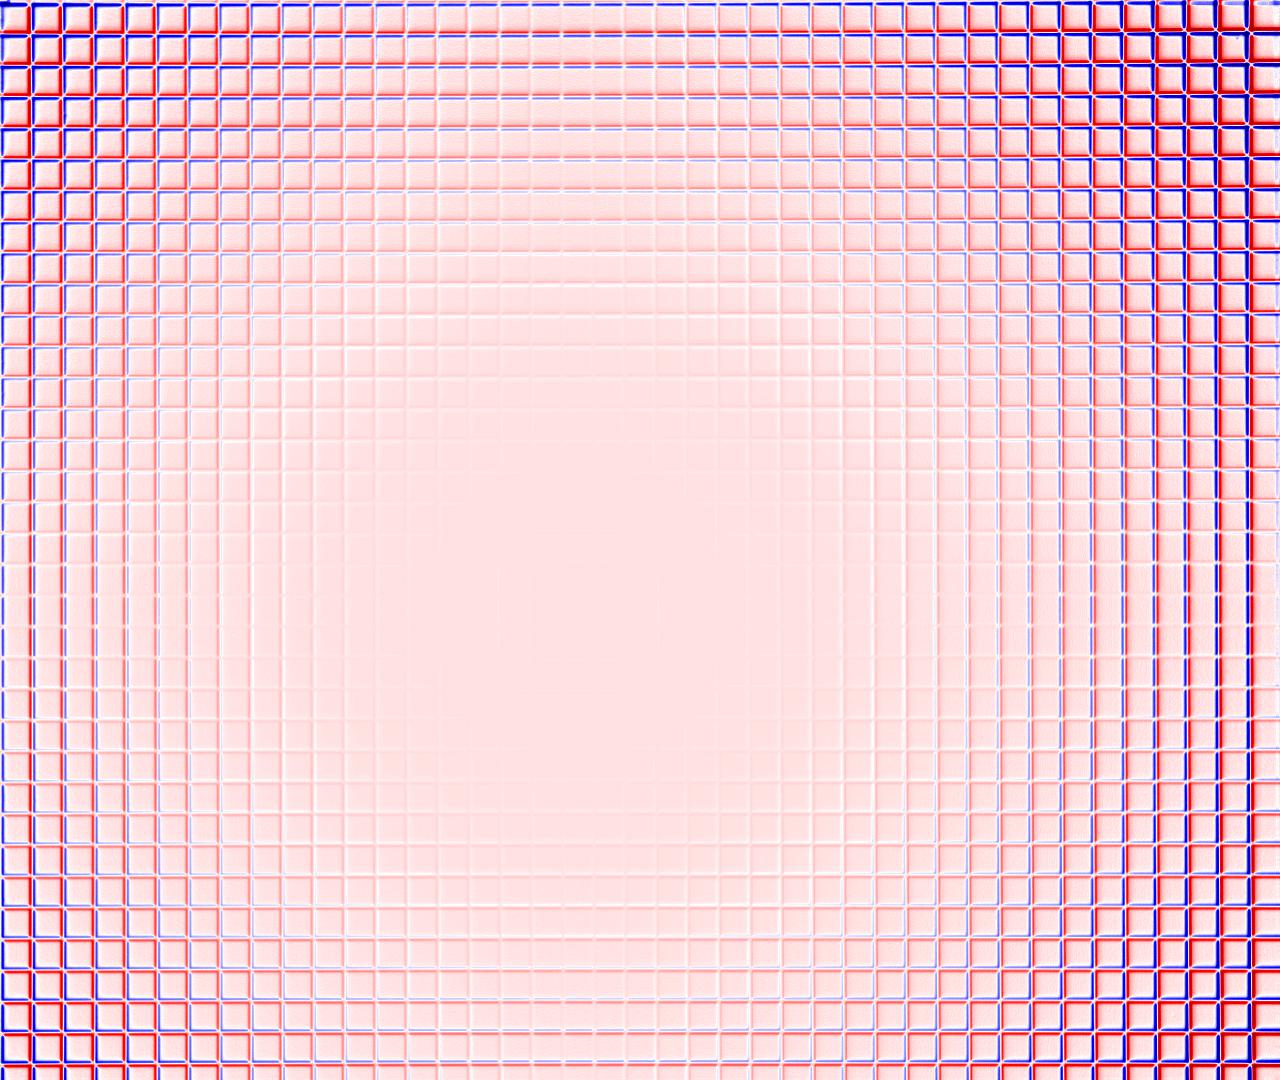
Fig. 3.3.4.7 Difference between images before (Fig. 3.3.4.1) and after (Fig. 3.3.4.6) unwarping.
Click here to download the Python codes.